Current KPI View
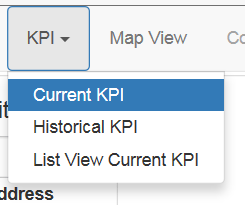
The 'KPI' menu item provides access to the 3 main status pages.

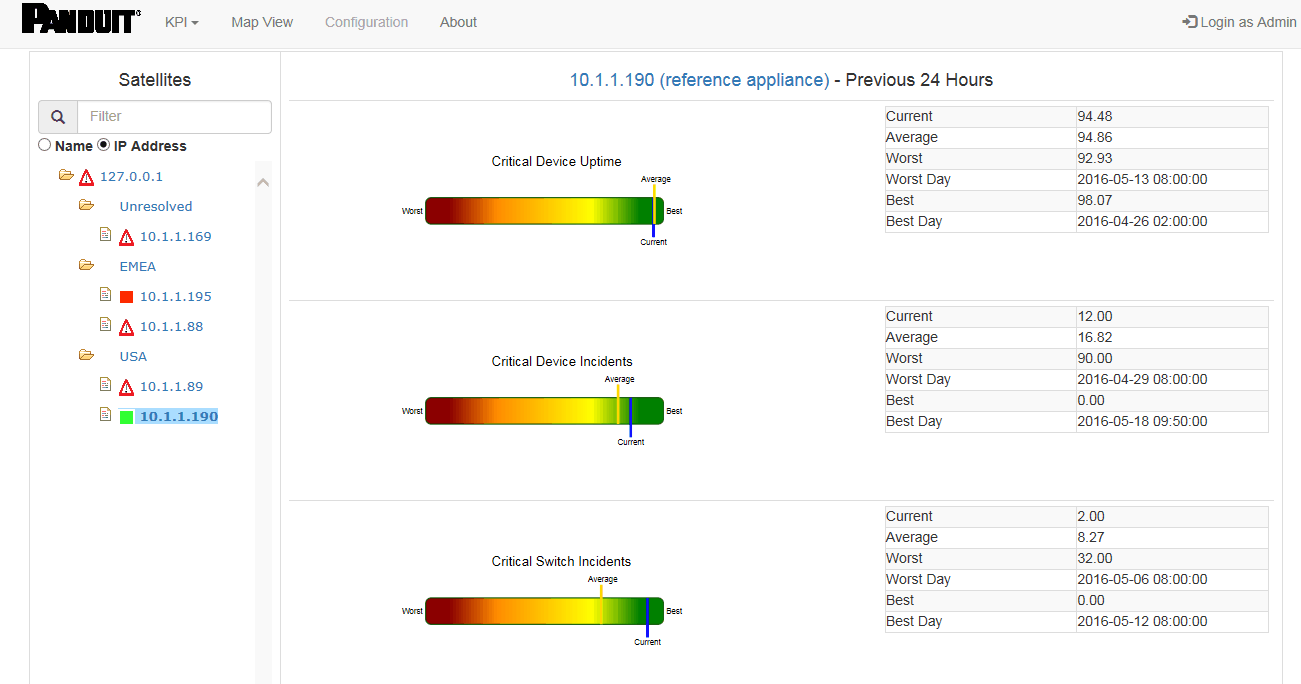
The Current KPI page compares the KPI statistics from the last 24 hours to the statistics from the last 30 days.
Each colored bar represents a range of data. The left side of the bar is the worst value in the last 30 days, the right side is the best value for the last 30 days. The actual values are displayed to the right of the bars as well as the date/times those occurred.
The yellow bar shows where the 30 day average is located between the worst and best days. The blue bar shows where the last 24 hours compares to the worst and best days. The position of the yellow and blue bars indicate if the KPI values are improving or not.

On the right are the actual (msec) values used in creating the bar charts as well as telling you when the best and worst days were.
To see the statistics for a satellite, select the IP address or name of the satellite on the left side. A radio button allows you to change between those views.
An icon to the left of each satellite indicates its current Combined KPI state set by the sliders in the configuration dialog.
![]()
- Current Combined "Best" KPI state or good communication

- Current Combined "Average" KPI state or okay communication

- Current Combined "Warning" KPI state or degraded communication
![]()
- Current Combined "Worst" KPI state or bad communication

- Satellite disconnected. Responds to ping, but does not respond on port 8765 to Standard KPI request
(Could be non-IntraVUE device or IntraVUE with no Standard KPI)
![]()
- Red Exclamation Triangle - Indicates a problem (see below)
![]() Black X - device is defined in supervisor but has not been found on the network
Black X - device is defined in supervisor but has not been found on the network
Problems include:
- No connection to the satellite
- Connected satellite IntraVUE™ is not running.
- Satellite does not have a version of the software that supports the latest version of KPI or no KPI devices have been configured.
- No devices are set to a KPI status that is not 'unknown' in the satellite.


