Historical KPI View
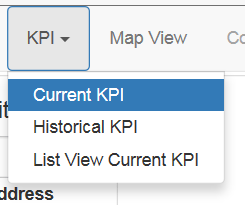
The Historical KPI view is selected from the KPI menu item.

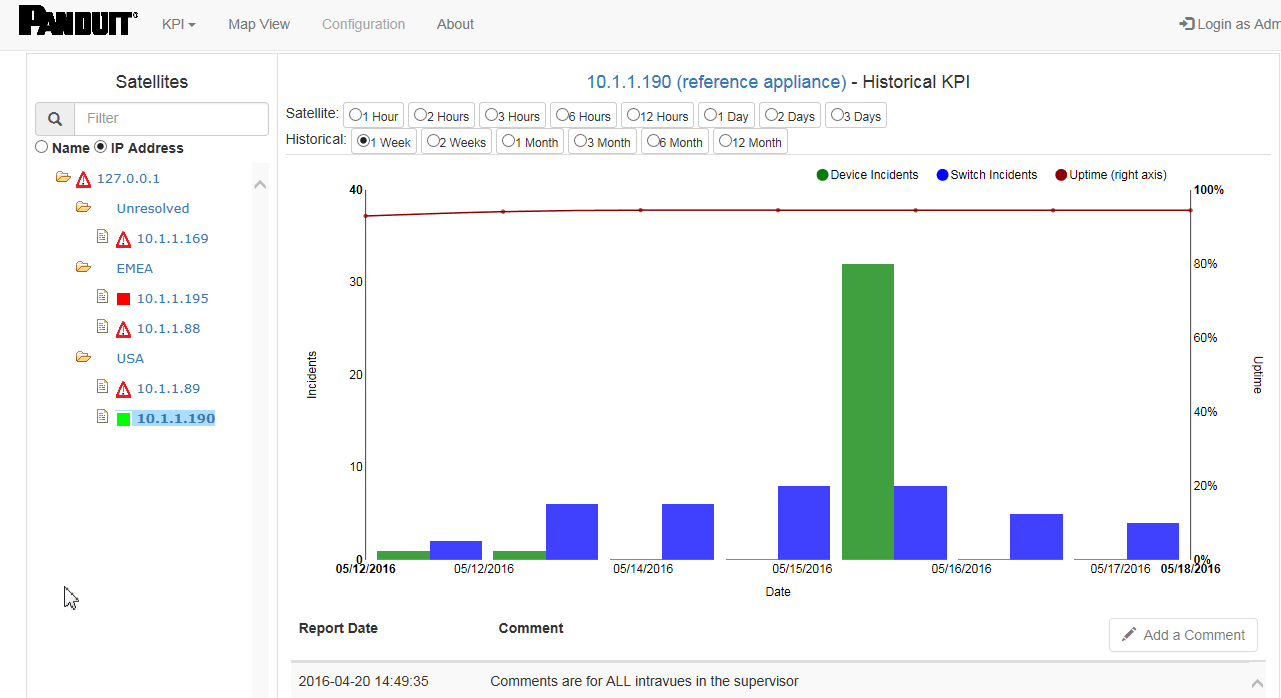
The Historical KPI chart shows the daily total device incidents, switch incidents, and uptime percentage for many time periods up to 1 year.

On the left of the graph is the scale for device and switch incidents. On the right is the scale for uptime.
At the top of the graph you may select which time period you are interested in viewing, from 1 hour to 12 months.
An 'Add Comment' button allows the user to enter comments to document or describe any unusual conditions. The comments will be displayed below the graph. See
Selection of satellites and the color coding to the left of each satellite is as described in the Current KPI page.
Details on the data used for various periods
| Period | Data |
| 1 hour, 2 hours, and 3 hours | values are based on 2-minute intervals |
| 6 hours, 12 hours, 1, 2, and 3 days | values are based on 1 hour intervals |
| 1 week, 2 weeks, 1 month, 3 months | values are based on calendar days |
| 6 months and 12 months | values are based on calendar months. |


