Keeping Track of Port Speeds
Ethernet communications between automation devices and switches can occur at different speeds. Older equipment may only operate at 10 MBPS, while newer devices operate at 100 MBPS, and Computers can communicate at Gigabit speeds. Switches provide the flexibility and buffering so that communications between two devices can occur even with different connection speeds. This can also be aggravated by the various ages of equipment and their different communication capabilities. These speeds can either be automatically established by negotiations between the switch and device or manually set.
Choosing manual or auto-negotiations may depend on the device and application. Other considerations for speeds may be due to quality of the connection and its susceptibility to noise, reflection, or other interference.
It is useful to know the current speed of the connection as well as if the connection is changing speeds due to the issues stated above. IntraVUE now provides an easy method to view the current connection speeds as well as logging any changes in speeds to help in troubleshooting connection problems.
In order to determine the speed at a connection with IntraVUE, simply right click on the connection. A window will open with connection details that will include the Link Speed. This is seen on the top line in the picture below. If the device is connected to an unmanaged switch as seen in figure 1B but has SNMP enabled, the speed details will be obtained from the actual device. IntraVUE will display the source of the data as seen in the two pictures below.

Figure 1A: Link Speed Data from the managed switch
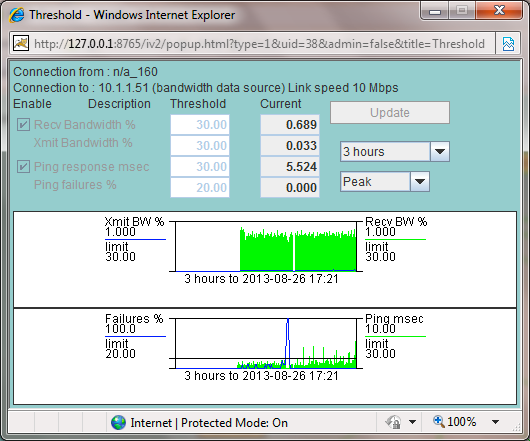
Figure 1B: Link Speed Data from the Device via SNMP
IntraVUE will record the initial port speed and any changes to the speed over time. This can be very valuable information in the identification of any changes in speeds that typically indicate either a problem connection or poor quality signal. Many of these issues that may affect port speeds may not have a severe effect on the application. Performance may degrade and recover before there can be any analysis for the location and reason for the slowdown in performance.
Upon the initial discovery of a switch the ports will be reported as going from 0 to their current speed. Only the active Ports that are connected to the devices in the IntraVUE scan range will be shown on a per network basis.

Figure 2: Initial discovery of the port speeds on a switch in the Event Log
Speed changes by connection will also be displayed in the event log. Anytime a change of speed is reported it will be recorded with the date, time, and change in speed. These will appear with other events being logged by IntraVUE. In order to filter for only the speed events you can place the word “speed” in the Additional Text Field and only speed events will be displayed.
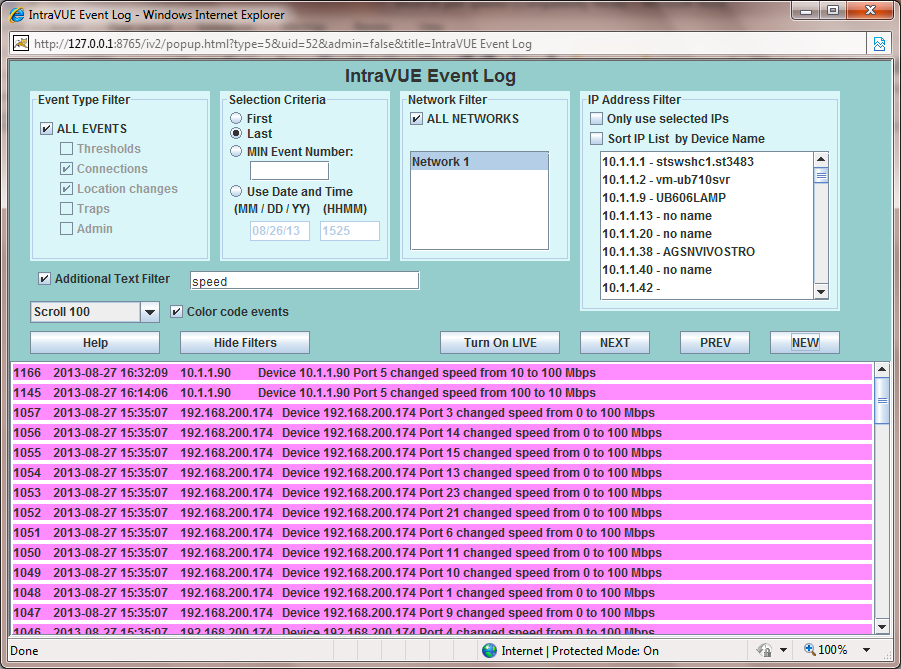
Figure 4: Filtering for all speed changes in the IntraVUE Event Log
Adding the specific speed change in the text field you can filter the entire database to find changes, ie; going from 100 to 10 MBPS or from 10 to 100 MBPS can filter and look for specific speed changes and the frequency of the changes. Using 1000 would identify if any communications were taking place at Gigabit speeds.
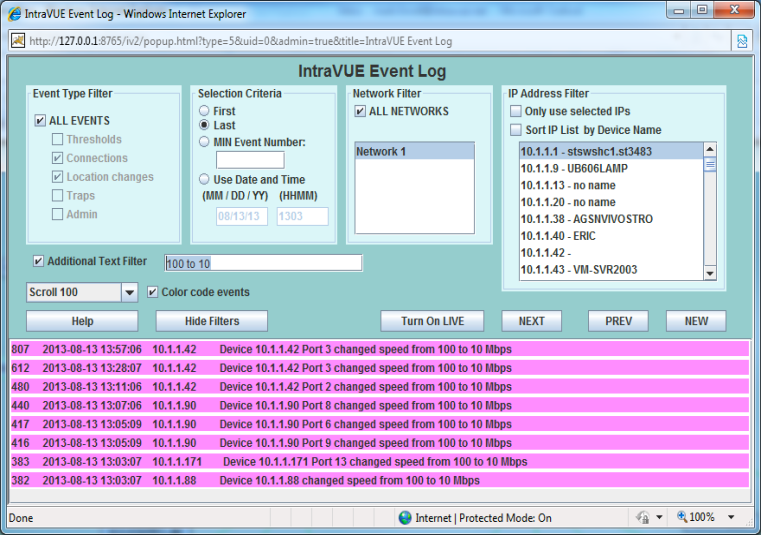
Figure 5: Filtering for speed changes from 100 to 10 MBPS in the Event Log
Once a connection is chosen you can adjust the filtering which will add the other events for this specific device such as SNMP communications, ping failures, ping response times, and bandwidth issues. This may provide addition details of the effects on the device during a speed change.

Figure 6: Filtering for all events for a device during a speed change
Selecting the switch and the connected device in the IP Address Filter will provide a means to obtain specific details that can provide potential reasons for a speed change.
Identifying Auto-Negotiation issues
The use of IntraVUE to identify auto-negotiation problems can eliminate one of the major causes of intermittent disruptions on the network. If a connection is lost or if the signal quality should degrade, switches that are set for Auto-Negotiate will try to establish communications by switching speed and duplicity. This may reduce communications from 100 MBPS to 10 MBPS and the available bandwith used on the connection will increase 10 fold for the same communications. This can be seen in Figure 7B.
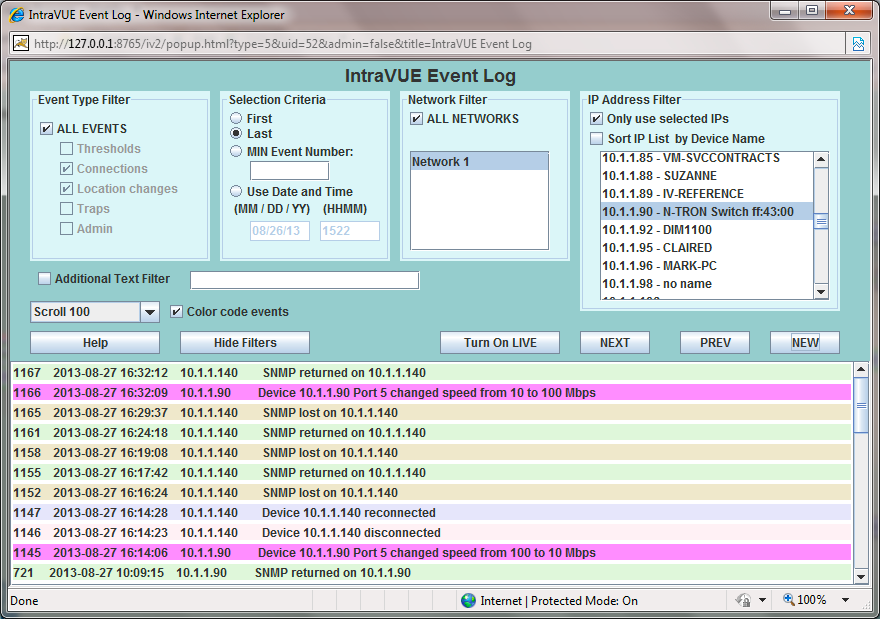
Figure 7A: Events surrounding a speed change
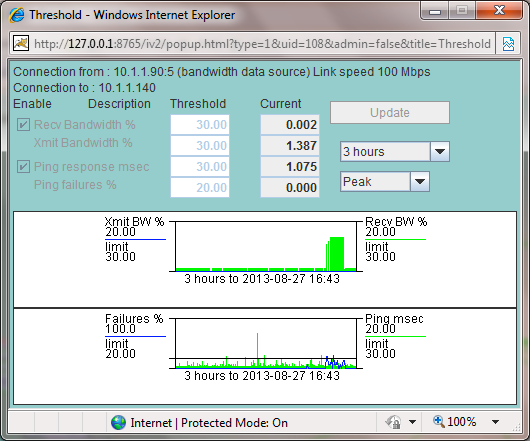
Figure 7B: Trend graph with an increase in Bandwidth and ping failures
Conclusion:
The addition of monitoring and graphing the Port Speeds will provide another key capability that will help individuals identify subtle issues that can effect performance and interfere with real time applications. Any device having both ping failures and Port Speed changes should have the configuration of the device and the port of the switch reviewed. These details will also be used for our Diagnostic Reports and Network Health Status, which will help individuals that are not Network Experts deploy and support equipment communicating over Ethernet.


