Understanding Spikes in Network Traffic
One issue that can affect the performance of an automation application is when the network receives a burst of traffic that interferes with real-time data flow and creates application problems or lockups in automation devices. These disturbances may only occur for a short period of time, but can stop devices from communicating as they are not able to recover from the burst. By the time you can run network sniffers to analyze the problem it may be too late to capture any real details. One may be left hoping that the problem reappears when you are ready to capture the disturbance.
IntraVUE has proven to provide graphic proof of spikes in traffic and will help determine if the issue is a point to point Unicast burst, or a Multicast/Broadcast and the devices that were affected. Many switches are able to throttle these bursts and it may only be the local switch that is affected. IntraVUE provides a method that identifies many of these incidents and the data is stored so that analysis can happen hours after the occurrence.
Live Graphical View
IntraVUE’s graphical view changes from green (healthy communication) to yellow (parameter exceeded) when the traffic on the link exceeds a preset limit.
The picture below provides a quick view of two devices establishing communications that have exceeded the limits set. In this example a contractor connects to a switch and downloads a large configuration file to a drive system. In the process the link between the N-Tron switch and a Dell Switch also exceeds its limit that has affected devices below the N-Tron switch which are reporting information to SCADA systems upstream of the switch.
IntraVUE showing two devices with a large data transfer
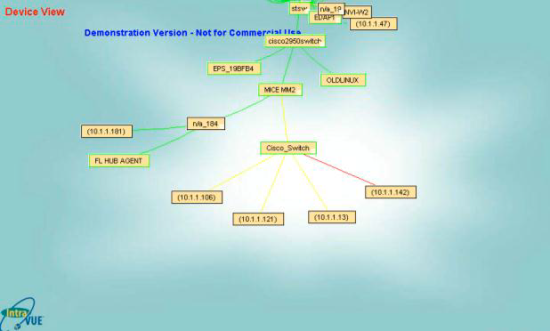
The graphic below shows all the ports on a switch in an alarm level. Broadcast traffic problems can over-run all the ports on a switch and flood all the connected devices with unwanted traffic. In addition the 10.1.1.142 device stopped communications as a result of the overload.
Yellow lines can be due to traffic exceeded or Ping response times exceeded as the switch shuts down port traffic.
Apparent broadcast storm on a Cisco switch
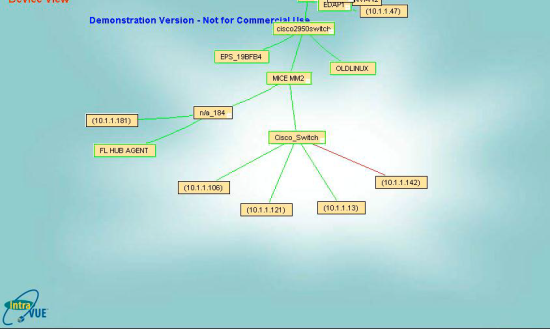
When the Broadcast storm ends and the switch and its links recovers however, the 10.1.1.142 remains disconnected. If one is not looking at the display during the time of the disruption, you would see only the device disconnected but no visual indicators in the display. IntraVUE however has stored all the events in the event log and can display a trend of the data to easily provide details of the past event.
Broadcast Storm ended but a device did not recover
Viewing a disruption that has occurred in the past
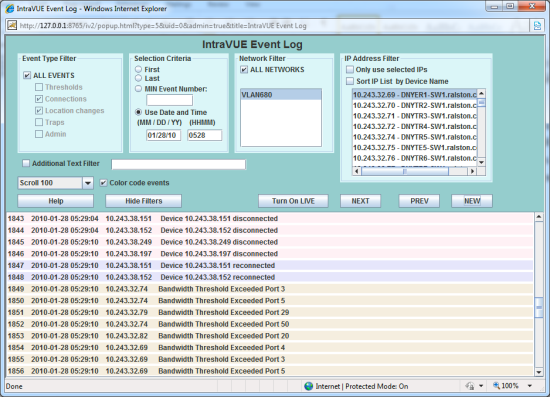
IntraVUE captures the details of the network parameters and stores the data in a relational database. Selecting the disconnected device and choosing the Event Log you are able to see that several devices had exceeded transmitted traffic prior to disconnecting.
Expanding the event log to include all devices at that specific time will provide additional details of the devices affected and the ports that carried the excessive traffic. Many of the affected devices that had lost connection were back online. Only one device was unable to recover.
The Event log provides a method to look at a time based “cause and effect” that can help provide necessary details for solving the problem.
In addition to the Event Log to identify the time and devices affected, IntraVUE provides Trend Graphs that provide additional methods of viewing the collected data. It can provide a way to determine if the excessive traffic was “point to point” Unicast or “one to many” Broadcast or Multicast.
Trend Graphs for Bandwidth Data
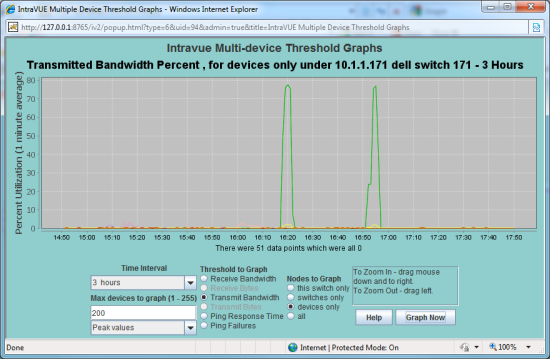
The time based trend graphs provide another visual for assisting in the analysis of excessive traffic. The Trend Graph allows the selection of a specific parameter such as Transmitted data or Received data. You can also choose to look at this on a specific switch or a larger area including the entire network. By looking at the results of both Transmitted and Received you are able to link the connected devices.
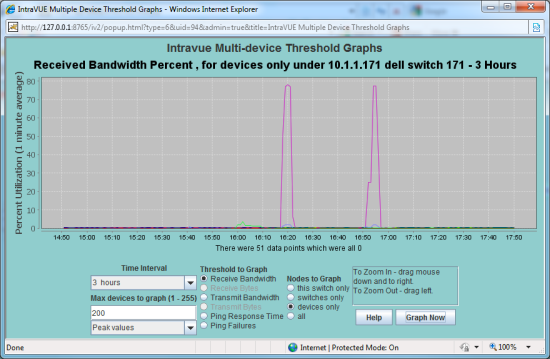
Large File transfer between two devices can easily be seen from the displays below. The display shows at two separate times there was a large data exchange between the two devices.
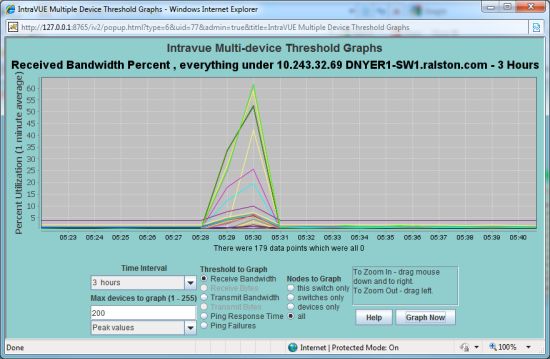
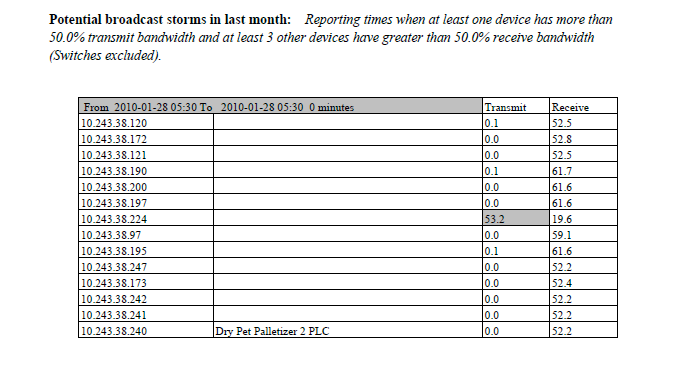
If there was a single device transmitting to many devices at the same time it would most likely be caused by a Multicast or Broadcast. In the figure below 10.243.38.224 generated an unusual level of traffic exceeding 50% of the available bandwidth and at the same time many devices reported a spike in receive traffic.
These trend graphs provide additional details to enhance the data provided in the Event Log. This information can be easily obtained by using the various screens available in IntraVUE. If the individuals responsible for support require additional assistance to help identify these problems, IntraVUE provides the ability to take the recorded data and send it electronically to a diagnostic report generator in which a written PDF report is sent to targeted individuals via email with details.
IntraVUE Diagnostic Reports will contain a section that highlights these two types of events in the PDF that will makes it easier for the local resources to understand the problem and the devices affected.

IntraVUE provides a variety of ways to help you identify burst of traffic that can occur and create problems for automation systems. The recorded data means that these intermittent issues will not require your constant attention. This is just one of many capabilities which makes IntraVUE the solution for automation people supporting automation networks.

