Main Browser Screen
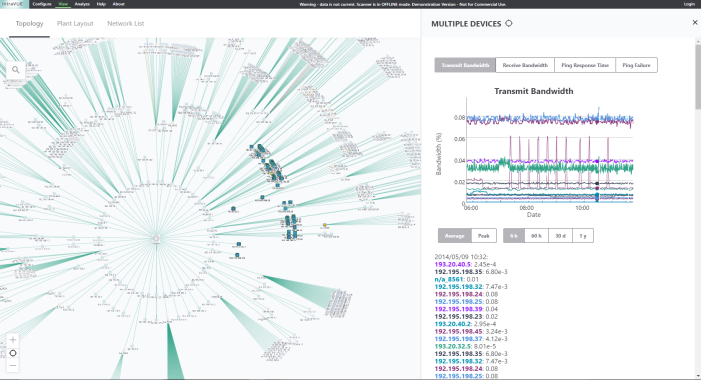
The initial browser view of IntraVUE shows the organization of all devices within each configured network. This is called the Topology view.
The IntraVUE™ 3 user interface is provided thru a browser such as Internet Explorer or Mozilla Firefox. On the host computer the URL can always be entered as http://127.0.0.1:8765. From any other computer that can ping the host, you may see the same thing by substituting the IP address of the host for the 127.0.0.1, for example http://192.168.1.55:8765. Note: the colon and 8765 is required after the IP address and typically you must also enter the http:// in Internet Explorer.
A video is available which covers basic navigation, colors, and operation IntraVUE™ 3.
The Top Parent of each network will be one node away from the "scanner" node at the center of the screen. The network is visualized as a star or tree of devices radiating out from the "scanner". This patented method is called a hyperbolic tree.
Individual devices or nodes are shown as colored circles connected by colored lines indicating the connection between the devices.
Drag all nodes on the screen by holding down the left mouse button until the part of the network you are interested in get toward the middle. Attributes of nodes are largest in the middle when you zoom in and they gradually disappear as you zoom out or move in either direction (north, south, east, and west).
You can think of the IntraVUE visual display as a flat network diagram that has been wrapped around a ball, and you can see only part of the ball.
This graphical feature allows very complex networks to be displayed in a single window.
View Controls
There are several controls that may be used with the IntraVUE user interface.
• DEVICE - click on a device brings up a right slider bar with Single View Details including Device Info (Default Details, Advanced Details), Threshold Graph, Events Log.
• SWITCH - click on a switch or router brings up a right slider bar with Single View Details (Device Info, Threshold Graph, Events Log), and Sideview Aggregate Details (Multi-Device Threshold Graphs).
• ROUTER MENU - click on a device brings up a right slider bar with Single View Details including Device Info (Default Details, Advanced Details, Additional Interfaces), Threshold Graph, Events Log.
• CONNECTION MENU - click on a connection line to bring up information about the connecting nodes including Port Information, Ping Response/Failure Graph, and Transmit/Receive Bandwidth Graph.
• CRTL-KEY LEFT CLICK HOLD MOUSE BUTTON - to draw an area around multiple nodes to bring up the Threshold graphs just for these highlighted devices.
• DRAG WITH LEFT CLICK HOLD MOUSE BUTTON - moves the entire network to shift the devices that are seen in the center or edge of the browser page.
• ALT-KEY PLUS LEFT MOUSE BUTTON - shows the line length factor as a black circle. If you continue to hold the mouse button down you may change the size of the line length. This is applied to all lines.
• HIDE SLIDER - click on the map view to clear right side slider bar.
•MULTIPLE DEVICES - CRTL-KEY LEFT CLICK HOLD MOUSE BUTTON DRAG AREA - opens a slider on the right side showing IP addresses of the highlighted devices.
Admin Controls
This is another form of the Mouse Controls above. Requires you to login as Admin.
• SYSTEM MENU - click on the header bar options (Configure, View, Analyze, Help, About, Login, Topology, Plant Layout, Network List).
• DEVICE MENU - right slider panel with options for device, switch, router, connection,
 Network List allows you to display in both Topology and Plant Layout views a subset of configured networks by using the toggle button for each network.
• EXTRA INTERFACE INFORMATION - zoom in or zoom out to see the other IPs of devices like routers.
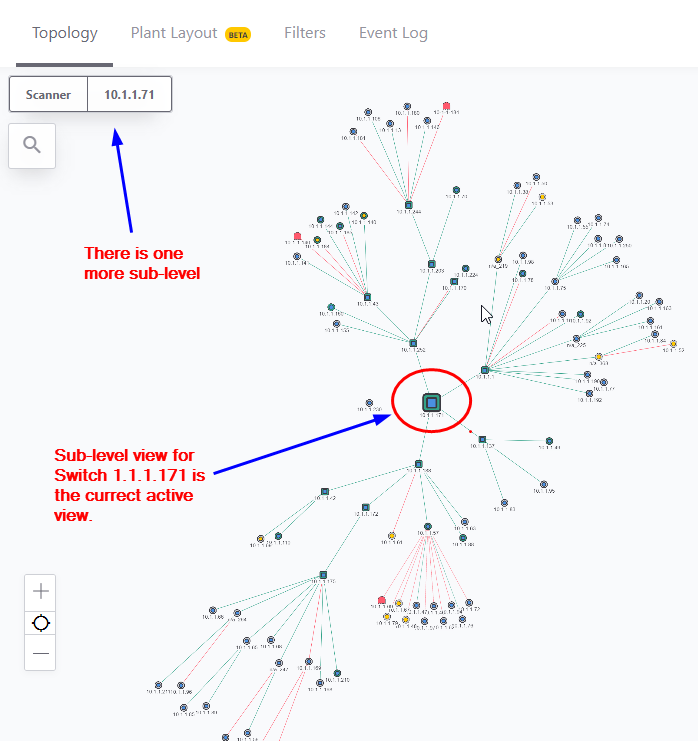
Sub-Levels View
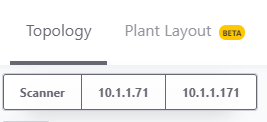
To simplify the view of a complex network, nodes or switches that have child nodes connected to them may be hard to see as a the number of nodes in the topology view increases.
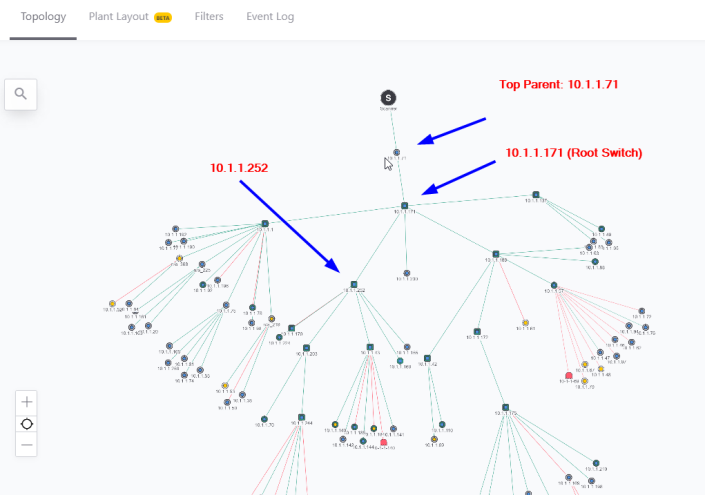
By double-clicking on a node with many children will reveal all its child nodes connected to that device in the sub-levels view.

To go up one or more levels in the sub-level views simply click on one of the parent switches IP addresses. If you want to go back to the Scanner Level view simply click "Scanner".
This view does not prevent any alarm or threshold event from occurring.
Alternatively, you can also make IntraVUE™ only show one or a combination of configured IntraVUE™ networks. See IntraVUE 3 Filters