IntraVUE Diagnostics
IntraVUE provides a method to record and capture the issues that occur in the Ethernet networks being used for automation applications. Automation networks are susceptible to subtle disturbances due to the real time nature of the applications, as well as the timing requirements of the connected equipment. Environmentally created problems, as well as “cause and effect” actions can create intermittent disturbances that will be hard to detect by conventional networking tools.
Although IntraVUE can provide an accurate assessment of the connected devices and their interconnections, it is the ability to sense problems on the network that provides the greatest value. IntraVUE has helped quickly identify many common problems in these automation networks. The following covers the variety of issues identified by IntraVUE and how they are represented. These include:
1. Device failure
2. Duplicate IP Address
3. Broadcast or Multicast Storm
4. Intermittent Connection problems
5. Devices accidentally moved
6. Foreign computers momentarily linking to the network
7. Large File transfers between devices
8. Bad RSTP, Ring Switches, or accidental cable loops
9. Resetting Switch
10. Overloaded or misbehaving devices
Device Failure
Device failures are common in any system. The key issue in an automation system is getting the failed device back up and running. This is especially important if the device has shut down a production line. The typical first responders are technicians who understand the devices but who may not have a great deal of network experience. It is thus important to provide the details so that the device can be reset or replaced .
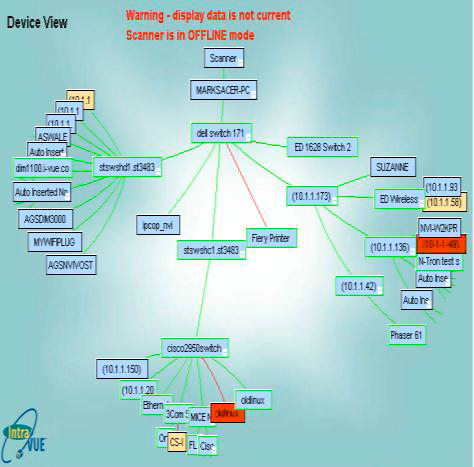
IntraVUE provides a live animated graphic that can show a disconnected device by a red line. Hovering over the line will provide details as to the port on the switch the device is connected. Figure 1. A first check would be to see if the connection to the switch is still made. Many times a disconnected device may be as simple as a connector dislodged as someone works on the switch.
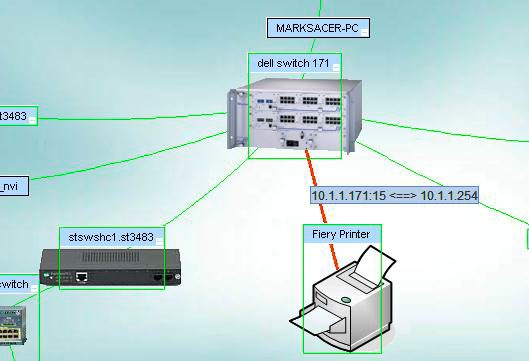
Figure 1. IntraVUE Visualization.
Additional details can be obtained on the time of the disconnection and if there have been several intermittent disconnections prior to the failure by opening up the event log. This information can be easily achieved by right clicking on the device and bringing up the event log for the device. The event log will contain a time based history of the device. The history can cover many months and thus if there are repeated issues they can be reviewed (Figure 2).
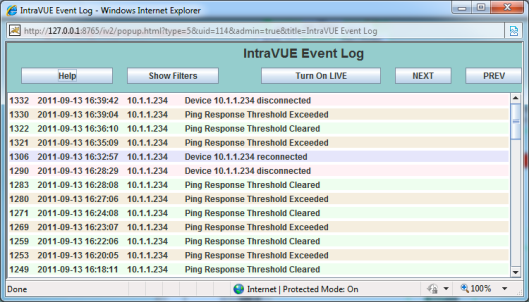
Fig 2. IntraVUE event log.
To obtain additional details for the affected device such as a maintenance log, user manual or other repair procedures one can click on the properties of the device (Figure 3).
The Properties window can provide the IP address and MAC address of the device as well as Vendor and Model. Since IntraVUE is a Web Server this data is available to any computer that can browse to the IntraVUE system. It provides both technicians and Control engineers a common tool to quickly resolve basic problems.
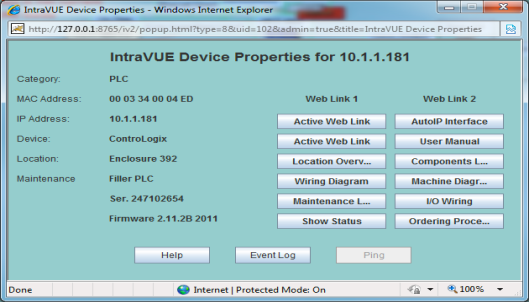
Figure 3. Device properties.
Duplicate IP Address
Most devices in an automation network will have static addresses. Since for the most part assigning an IP address to a device is a manual process, the chances of a device getting an address that is in conflict rises as the number of devices increase (Figure 4a). Duplicate addresses can create a great number of issues and should be avoided. It is thus important to quickly identify if a duplicate address has been added on your network.
IntraVUE can help quickly identify a duplicate address by tracking the IP, MAC and location of all devices on the network.
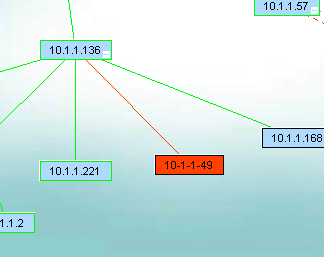
Figure 4a. IntraVUE showing a duplicate address in Map View.
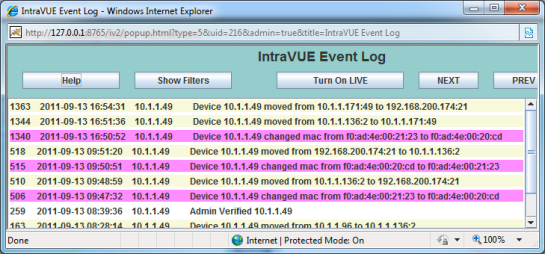
Figure 4b. Duplicate IP address confirmed in event log.
IntraVUE will mark an IP address that appears in two locations with a red box as seen above. By selecting the event log you will see the two MAC addresses listed for an IP Address. This provides details of not only a duplicate address but the location of both devices and the time the conflict was first reported.
This information is also presented in the Diagnostic Report (Figure 5). The report will use the data collected and by determining that an IP address is switching between two MAC address as well as changing locations in the network. The Diagnostic Report will create a red text to easily identify a duplicate address. See below:
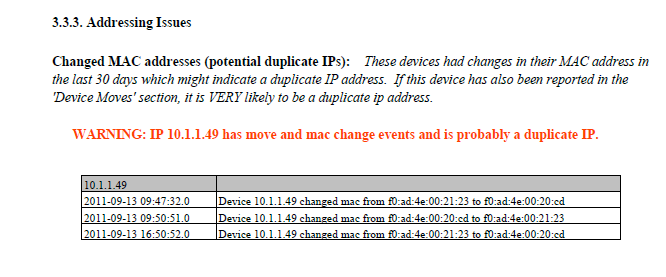
Figure 5. IntraVUE Diagnostic Report confirming a duplicate IP address.
Broadcast or Multicast Storm
At some times a device may generate a burst of broadcast or multicast traffic which will be received by many devices. The transmitted data may only last a short period of time and thus can be hard to find if not continually scanning for the occurrence. IntraVUE records and stores all of the transmitted and received levels on a minute basis and this recorded data can be used to determine not only the sources but also what devices may have received the bust. Using the Threshold Graphing feature one can choose to view all devices transmitting over time. In figure 6 you can see a single device generating a burst of traffic that exceeds 50% of the available bandwidth.
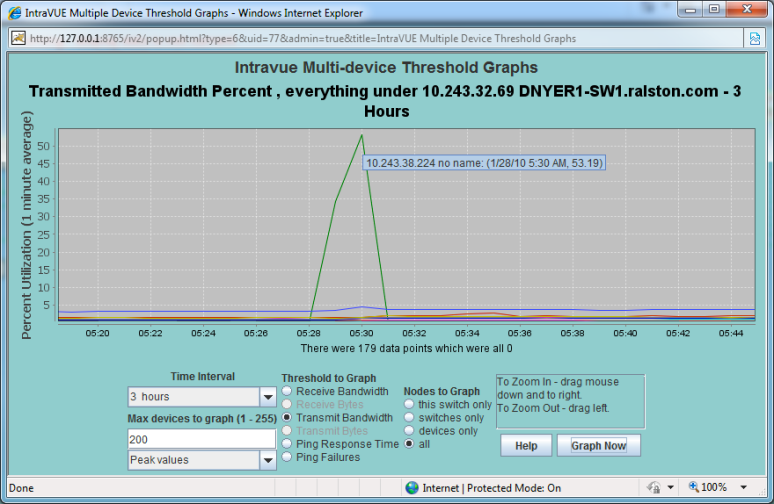
Figure 6. Transmitted data graph clearly shows IP and time
In figure 7 now listing Received Traffic you can see a group of devices that have been affected by the transmission. The data used in this example is from an actual customer application.
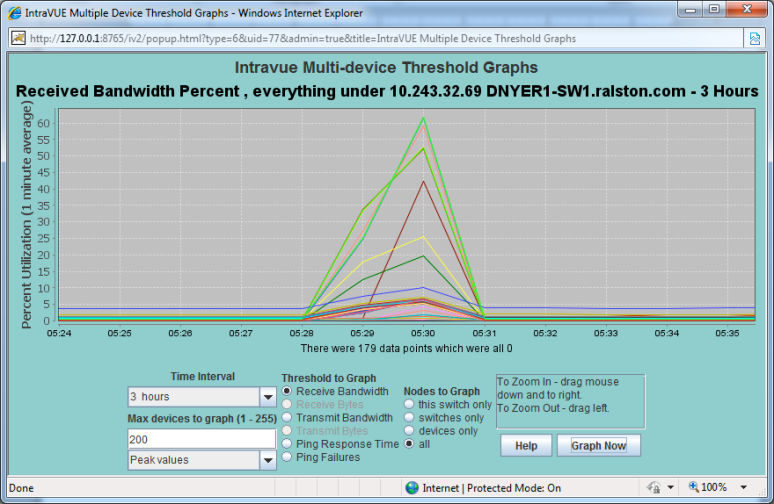
Figure 7. Received data affecting many devices on the network.
If one were to use the Diagnostic Reporting system (Figure 8) the data would have been presented in a table in which the IP addresses of all the affected equipment would be identified.
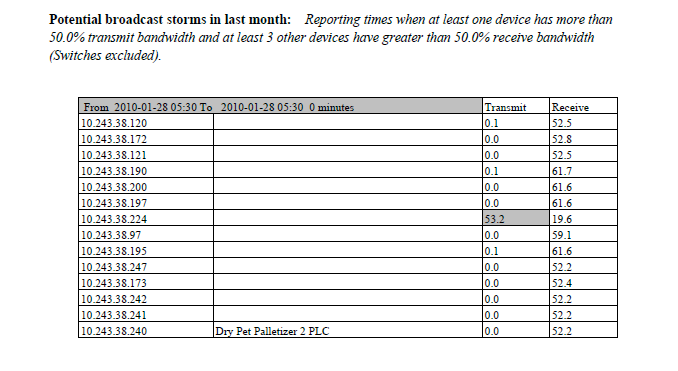
Figure 8. Shows sources of broadcast storms.
Intermittent Connection problems
Based on the environment which may contain vibration, electrical noise, and moisture many industrial devices can experience intermittent connection problems. IntraVUE continuously pings all the devices that have been found on the network between 8 and 12 times a minute. Each minute the results are compiled in a percent % failure rate per minute and stored in IntraVUE. In a good network there should be no ping failures. Ping failure percentages can be trended in a graphed to identify if there are connection problems (Figure 9).
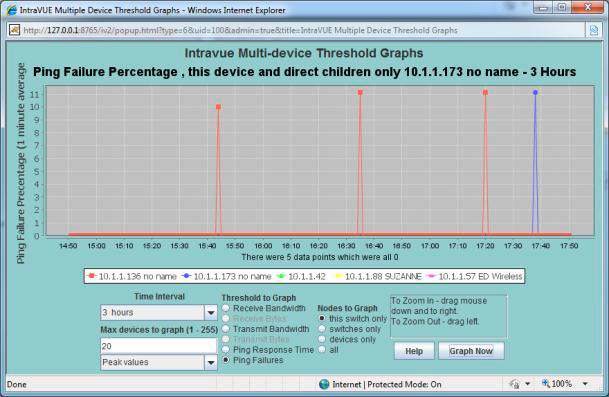
Figure 9.Time based view of Ping Failures
These graphs can help pinpoint the time and frequency of failures that help identify the potential causes. These can be created from environmental issues such as vibration or electrical noise from a large motor or a switch performing auto-negotiation based on a poor link. It can also display if a group of devices are affected at the same time which can point to a specific event or cause.
The diagnostic report (Figure 10) will list the devices with the highest connection problems. The list will contain the failures that have occurred over the last 6 hours, 60 hours and 30 days to determine if the faults are recent.
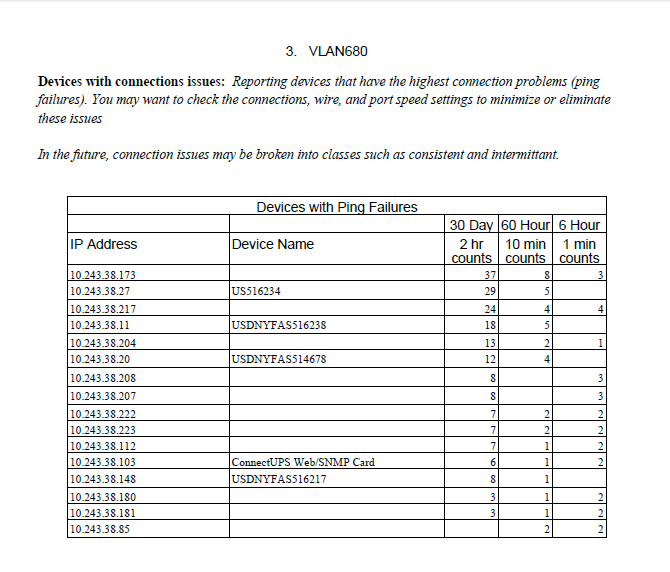
Figure 10. Report showing the most problematic devices.
Devices accidentally moved
Many devices in an automation network are fixed to a specific port of a switch. In many cases the port is configured with a speed and duplicity that matches the unique requirements of the device. In other applications the port may be assigned to a specific VLAN. Many of these switches are located in electrical enclosures and additional devices are added frequently. The potential for a connection to be accidentally changed due to device additions or just servicing the switch is becoming more common. In other cases we have seen equipment such as Printers/labelers moved to another line (Figure 11), which have created other issues when the original line is started and that equipment is expected to be there. Keeping track of equipment can be challenging.
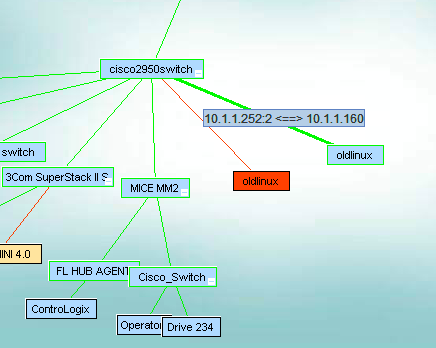
Figure 11. A machine move reflected in IntraVUE.
IntraVUE monitors the moves and provides a graphic indication if a device is moved. The picture on the left shows a Red Box to mark an unauthorized move and hovering over the connection shows the new port.
By selecting the Event Log for the device you can also get the day and time that the move was made. This may help identify details to avoid the move from happening in the future.
Diagnostic Reports (Figure 12) also provide a list and time of device moves. It can provide a very easy way for maintenance technicians to obtain a list of devices that have moved along with key data on the time and the original location.
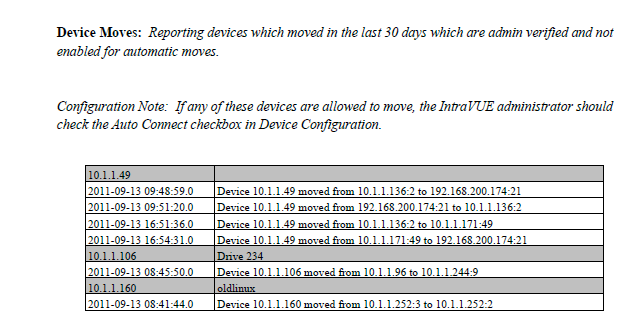
Figure 12. Devices moves reflected in Diagnostic Reports.
Foreign computers momentarily linking to the network
Security is important for any network. Although many automation systems are behind a firewall and have no access to the outside world, it does not mean they are fully protected. Outside suppliers can easily connect to the network. Even if the switches are locked in protected areas, one can use an Ethernet connection to an idle device to gain network access.
In many cases they may have the right to attach to the network but may inadvertently create a problem such as bandwidth problems when uploading a program or configuring a device. In some cases the foreign computer may only be on the network for a short time (Figure 13). Trying to identify an issue caused with the device now disconnected can be difficult.
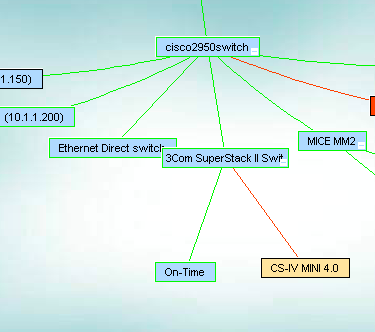
Figure 13. New device detected by IntraVUE.
IntraVUE identifies new devices with a tan colored box which is differentiated from the admin verified blue colored boxes. If the device is still connected to the network the line to the device would be green. A red line will indicate that the device is no longer communicating on the network. Clicking on the Event Log will provide details on the time the initial connection was made and if the device was moved to different locations in the network. If the device created traffic that exceeded the default presets it will also be logged and date stamped.
Large File transfers between devices
Large transfers between devices could affect network performance by overloading switch traffic. These transfers may occur for a few minutes and disrupt other applications. Disruptions can be seen as a slowdown in communications or can actually lock up devices. As more devices are connected and use the network for management and configuration as well as Enterprise system gather reporting data the traffic flow can be unpredictable.
IntraVUE can provide specific details on the interaction hours after the event occurred. Many times there is no one immediately available to determine the source of the issue. The recording capability of IntraVUE can provide a time based view of the transmission and receiving of large amounts of data. In the two pictures (Figure 14 & 15) one can see that there was a transfer between two devices that occurred at two separate times in the graph.
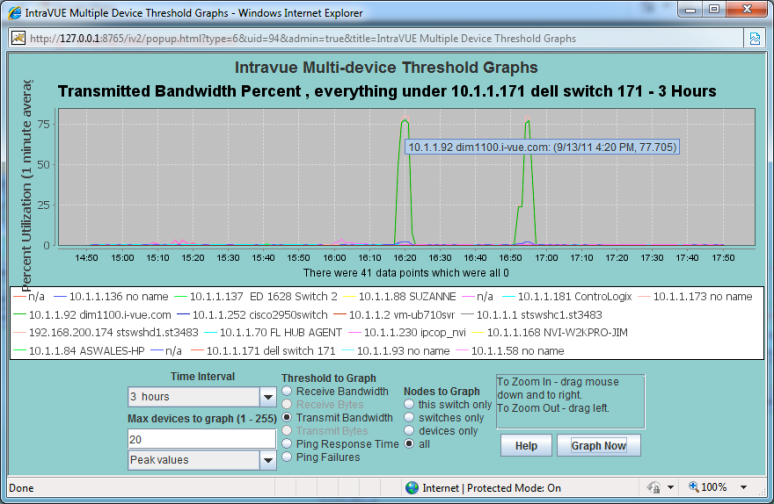
Figure 14. Sent data by source device according to Transmit Bandwidth graph.
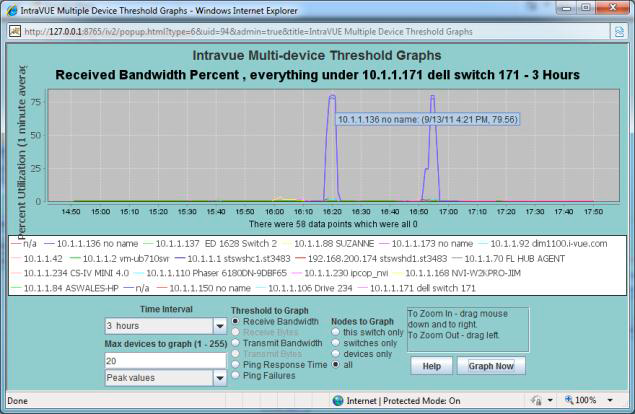
Figure 15. Received data by target device according to Received Bandwidth graph.
This data is also provided in the Diagnostic report so that the details are quickly identified without having to analyze and charts.
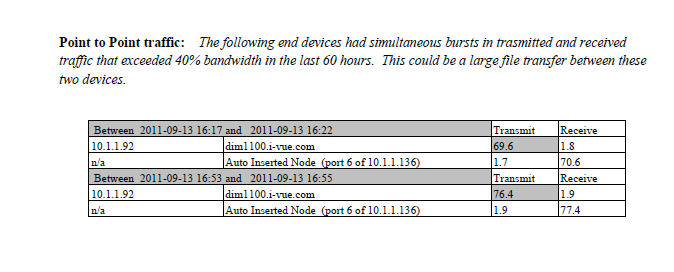
Figure 16. Same graphs as above are automatically reported in the "Point-to-Point Traffic" section of the Diagnostic Reports.
Bad RSTP, Ring Switches, or accidental cable loops
IntraVUE continually communicates to the managed switches obtaining details how the switches are seeing the location of the devices. The communications occurs once a minute in which data from the switches Bridge MIB is accessed. This information is used to provide an accurate mapping of the interconnections of the network. IntraVUE is not a wiring diagram (however in most simple cases it represents the actual wiring) but represents what port the switch will use to send traffic to a specific device (Figure 17). This is the heart of the mapping capability of IntraVUE which also contains many rules and exceptions to deal with more complex architectures.
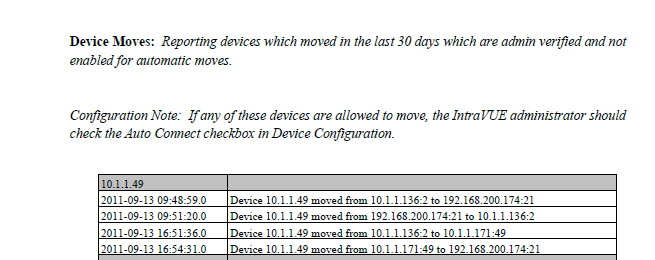
Figure 17. Diagnostics Report shows the source and destination IP Address and port number.
Occasionally the ability to have a single and consistent path for the switch can be interrupted. This can be caucused by a number of issues such as a loop back wiring, momentary link loses on a RSTP and Ring, or the switch being confused by MAC addresses that are too close in number. In these cases the IntraVUE may oscillate between to links or report MAC addresses on two different ports. These disturbances will be logged in the event log and may also be seen as the network changing in the main IntraVUE display. In this the IntraVUE is trying to accurately represent the network that is constantly changing.
Resetting Switch
It is important to identify if a problem is application or network related. In one case a switch was having difficulty and doing a periodic reset. This is not uncommon with older switches. Many are configured to reset if their cash memory reach certain levels. Others may reset based on a poor power connection. Whatever the case the reset may create a momentary disruption in data transmission (Figure 18).
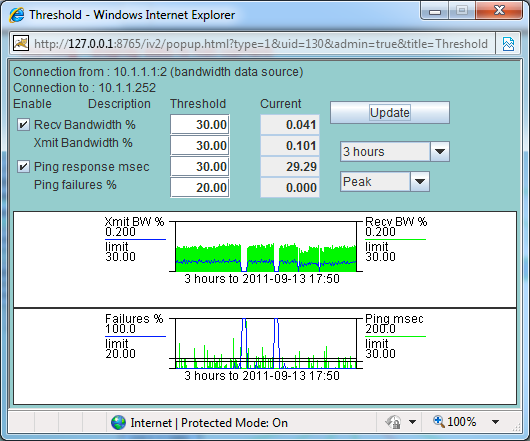
Figure 18. A sample of a switch failing.
IntraVUE trends the transmitted and receive data on a time line and below trend the ping response time and ping failure percentages below. This graphing can provide graphic evidence of the drop off of communications at the same time the ping failures go to 100%. The time basis also provides some clues to research to determining what may be happening with the switch at that time.
Overloaded or misbehaving devices
Automation networks contain many devices from several different manufactures. This diversity coupled with the ages of some of the equipment will mean at some point devices will start to have problems. One method to determine if a device is starting to have problems is a delay in the ping response time. By measuring the response time (Figure 19) continually IntraVUE can have a means to determine if there are any relative issues that may be represented as a change in normal response times.
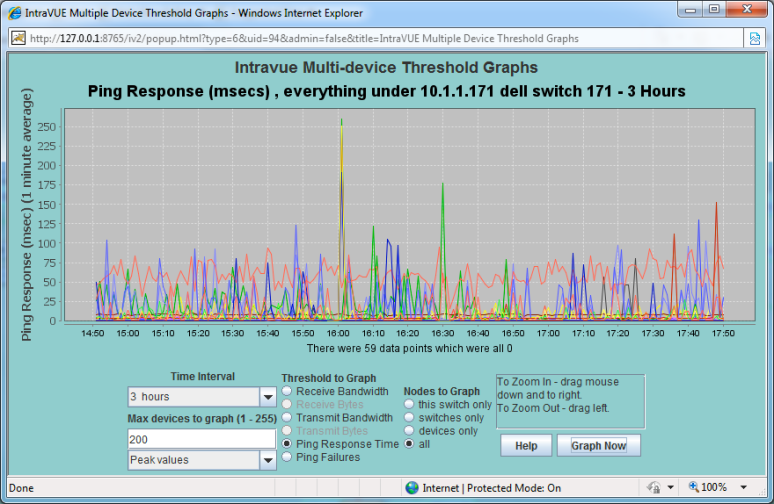
Figure 19. Ping response time measured for all devices in the map view.
By selecting all devices in a graph you can use it to see if an event has caused a group of devices to experience an increase in response time. This can help identify what devices were affected.
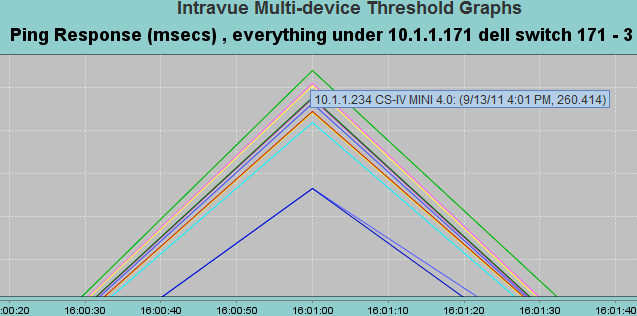
Figure 20. Multiple devices experience a delay at the same time.
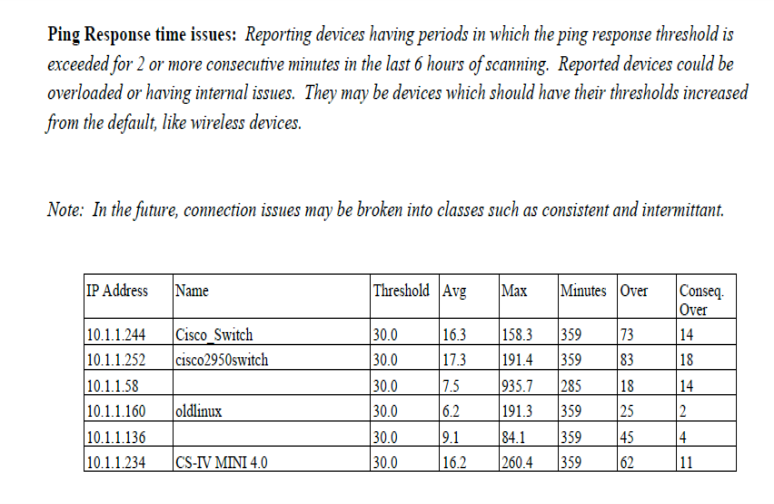
Figure 21. This is also shown in the Diagnostics Reports.
The IntraVUE solution uses the data being collected for a variety of methods of interacting with individuals. Support of the automation networks may be shared between maintenance technicians, control engineers, and IT or network professionals. Each may have a different level of skill and interest. IntraVUE provides a variety of methods as a means to focus on the issues relating to each and delivers information in a variety of forms.
Basic Diagnostic Reports
This has been referenced in the above as a way to provide analytical results based on our methodology. There will be a variety of reports to match the intention of the user. Visit http://www.panduit.com/intravuesupport for more details.
Maintenance reports will provide analysis of the issues occurring on the network
Asset Reports will provide a spreadsheet with the key data such as device details and switch port location.
Configuration Reports will help with the configuration of the IntraVUE system
Live IntraVUE Screen
IntraVUE provides a live animated graphical view that can be view from any computer browsing to the IntraVUE system. IntraVUE provides links to pop up windows that have been review in the above material.
This view is used by maintenance technicians and control engineers to quickly identify and resolve basic problems.
IntraVUE ivDashboard
The IntraVUE™ ivDashboard provide more experienced users with a way to associate the data collected in ways to help better review complex issues. It allows greater association of the devices with the switches as well as the inter relationships of the networks. The ivDashboard is used by Control engineers and Manufacturing IT people.
The ivDashboard tab shows detailed device statistics over the 6 hour period that IntraVUE™ maintains one minute resolution threshold data.
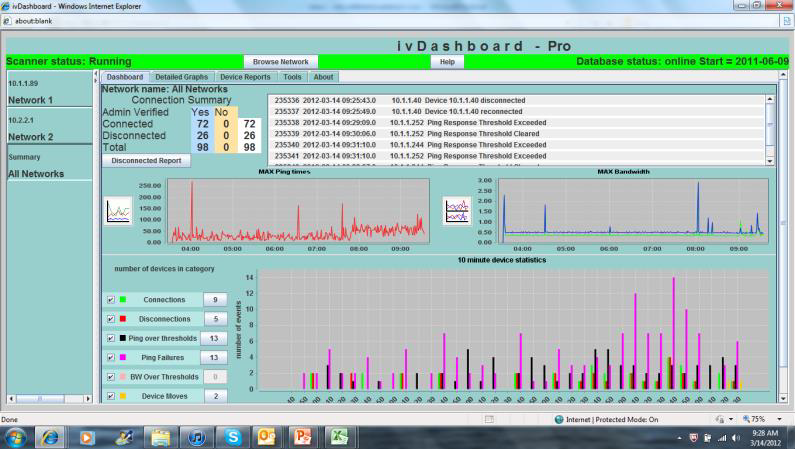
The upper part of the ivDashboard tab shows a Connection Summary and the last 10 events for this IntraVUE network. The data is automatically refreshed several times a minute to get new events and to update the connection data.
In the center of the ivDashboard panel are two graphs which show the maximum data point for each threshold for any device in the network. Based on what you learn as being 'normal' for a network, you should be able to spot changes from 'normal'.
The 10 Minute Statistics, at the bottom of the dashboard, provide an instant, visual indication of what is happening in the selected IntraVUE network.
On the left, each of the 7 statistics is listed with its color code. The checkbox at the far left determines if that statistic will be graphed. The setting is persistent when changing networks.
While the graph shows how many instances of the statistic occurred over the 6 hours, the number next to the statistic on the left tells you how many different devices caused the statistic. Its possible only one device caused a large number of disconnections or ping failures. In the image above, 6 different devices caused the 6 ping failures that occurred.
All three graphs have the option to be printed. Right click in the graph area an you will get the print option.
The ivDashboard comes with its own help.
The ivDashboard is compatible with IntraVUE™ 3.
Your License Product Key will let IntraVUE™ know if you have the ivDashboard feature (i.e. if you're an Advanced Subscriber).
See Downloads to get the latest version.
IntraVUE Supervisor
The IntraVUE™ Supervisor is used in large installations where many distributed IntraVUE systems are deployed. This can be in either a single large installation or a central support group supporting many different plants. The Supervisor monitors not only the health of the networks but also of the IntraVUE systems. It provides the ability of a single individual to oversee hundreds of IntraVUE systems and potentially thousands of networks easily.
See KPI Supervisor