IntraVUE Analytics
The IntraVUE ‘Analytics’ currently defined in the KPI system and the Diagnostic Report Generator are intended to supplement or substitute for the need for continuous monitoring or frequent event escalation. If a controls engineer can learn to recognize the health of his network by looking at a summary KPI display, and learn the value of submitting a database archive to the diagnostic report generator to allow for subtleties to be identified, then less time is spent diagnosing and more time is spent repairing.
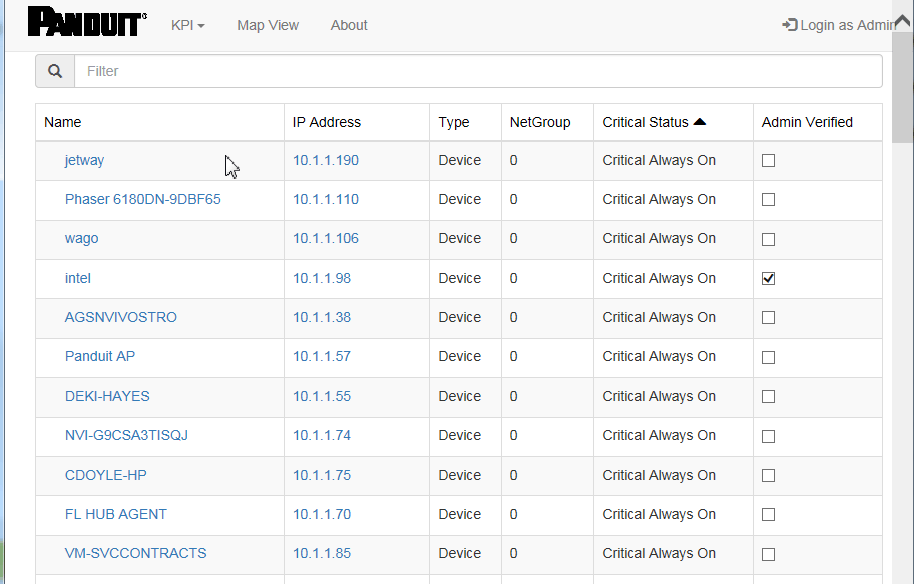
Start by setting critical status to all of the devices from the KPI List View in Completing Initial Configuration > Connect IntraVUE & Key Performance Indicators.
Critical States are set to one of the 4 critical values in .
![]()
- Unknown - devices which have not been configured.
![]() Standard KPI and Supervisor KPI Analytics do not take metrics from devices with "Unknown" critical status.
Standard KPI and Supervisor KPI Analytics do not take metrics from devices with "Unknown" critical status.
- Ignore - a conscious decision was made that the device is not critical and statistics for this device should not be in the KPI reports.
- Critical Intermittent - A critical device which may not be connected 100% and uptime should not be reported. All incidents are reported.
- Critical Always On - A critical device expected to be on 100% of the time for which uptime and incidents are reported.
You can set Critical States on a device by device basis from the User-Defined Device Configuration or you may do it in bulk using the Export / Import mechanism. If using the import / export method, be sure to set at least one device to a critical state or you will not see the correct column, "PKI.critical", in the csv export.
Critical Values for this column in the .csv export are:
0: Unknown
1: Ignore
2: Critical Intermittent
3: Always On
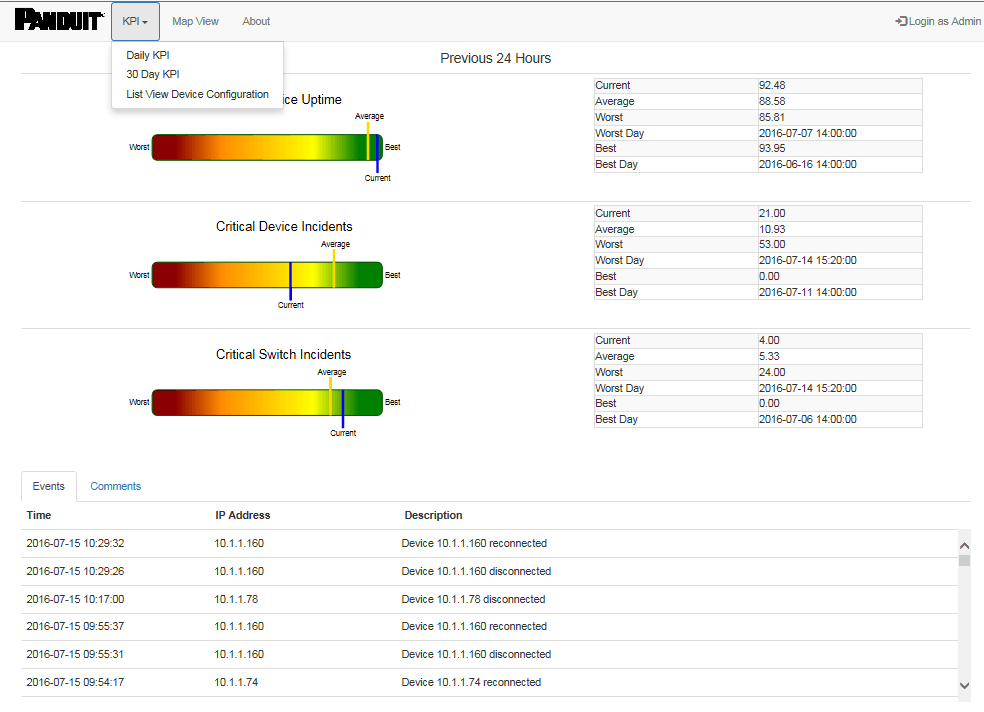
The KPI daily report is designed to show you how conditions in the last 24 hours compare to the conditions for the same devices over the last 30 days. It can be accessed by clicking on the 'Analyze' button in the latest version (or right-click on the Map View > KPI Status on earlier versions of IntraVUE).

30 Day Reports
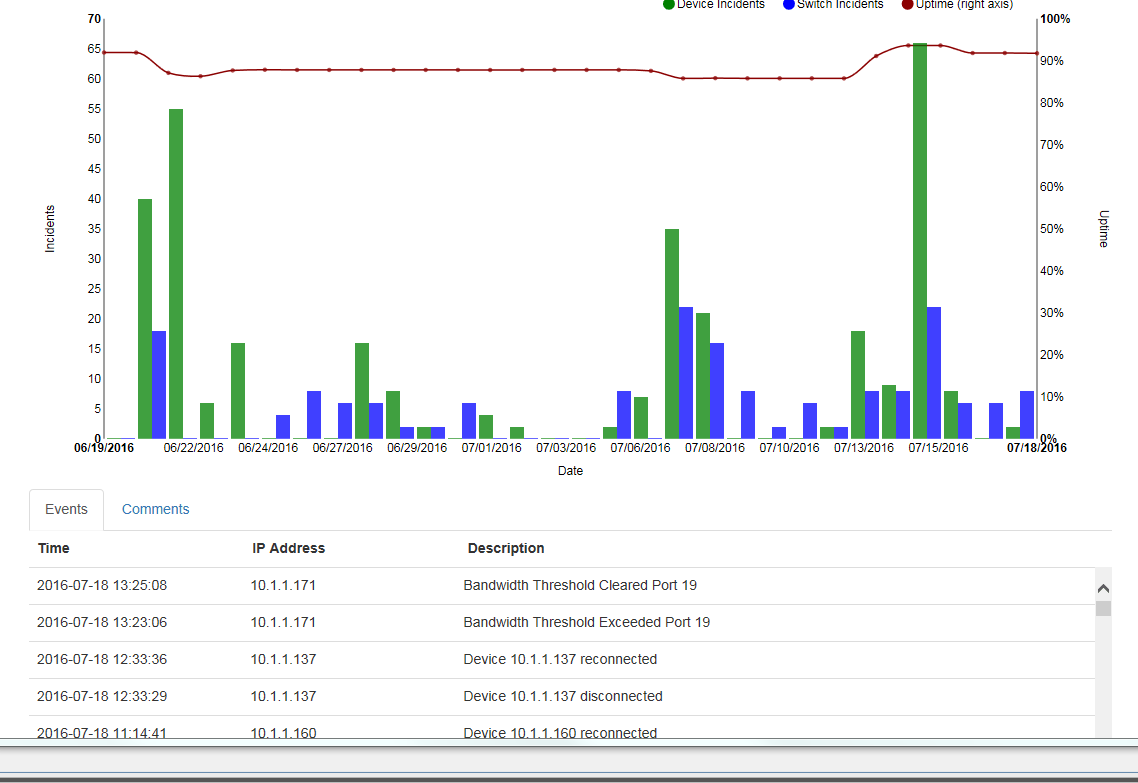
The KPI 30 Day Report provides you with the total device and switch incidents for each 24 hours over the last 30 days. It also provides the Uptime percentage for the Critical Always On devices on a daily basis. For this report a 'day' is a 24 hour period starting at the time the report is generated, not at midnight.

Similar to the Daily Report, at the bottom is a list of events that make up the statistics.
List View Device Report

See for more information
As Ethernet expands and is deployed into the heart of many Automation applications it will require Electricians and Technicians to have methods to maintain and support them. Most first responders are not individuals that will sit in front of a screen trying to understand the meaning of graphs and charts. Their job is to periodically check to make sure everything is running or if there is a problem to get details on the location of the problem and what to do to resolve it. They may be the only person at a location and are looking for suggestions on what to look at, and instructions on how to resolve an issue.
For others, there will be a need for a method to help interpret the collected data and automate the analysis to provide additional assistance. This can be used for many reasons such as help when initially configuring the system, periodic maintenance reviews, or if a disruption should occur that is not easily depicted in the displays.
 IntraVUE Reports are an additional capability of IntraVUE that will automatically generate written reports that identifies the issues as well as suggested courses of action for many common problems that can occur on Industrial Ethernet Networks. They can be generated in minutes and contain the latest data contained in the IntraVUE system.
Reports will be divided into several categories and generated separately which focus on different areas as well as intended users:
* Configuration Analysis (Assessing any configuration issues)
* Critical Devices Report (Asset Management with history)
* Maintenance Technician Report (Electricians & Technicians)
The Report Generator will take advantage of the recording capability of IntraVUE in which time based details are logged in a relational database. The Report Generator duplicates and automates the processes of our support engineer’s analytical procedures to interpret the data in order to provide accurate assessments in minutes. This is a written report with identified the specific issues with devices and recommendations for a course of action to solve the problem.
Refer to Diagnostic Report Tool for IntraVUE™ 3 Databases for more details.
 Start with an IntraVUE Automated Analytics Report to rapidly drill down to root cause
| Problem | How IntraVUE identifies the problem |
| Duplicate IP and MAC addresses |
IntraVUE will mark an IP address that appear sin two locations with a red box. Bringing up the event log for that device will show two MAC addresses alternating between the same IP address. This will identify the location for both devices as well as the time at which it began. |
| Degraded or Damaged Physical Connection or EMI | Ping failure percentages can be trended in a graphed to identify if there are connection problems. These graphs can help pinpoint the time and frequency of failures that help identify the potential causes. These can be created from environmental issues such as vibration or electrical noise from a large motor. |
| Insufficient Bandwidth | Look at Transmit and Receive bandwidth in threshold graphs, which show up as a percentage of available bandwidth. |
| Periodic bursts in traffic / Broadcast storm | When bandwidth shows greater than 75% utilization, there is risk to the performance of the network. Use the transmit bandwidth graph - device only – to identify the source of the broadcast storm. Use “Receive bandwidth” graph, all devices – to identify the affected devices. These disturbances may also be seen in the main map view with yellow lines going to a switch and down to the devices due to traffic exceeded or Ping response times exceeded. |
| Port Speed / Duplex Mismatch | Intermittent connections can often be traced to port speed mismatch. Right-click on any connecting line and IntraVUE will identify existing communication speed of that port. |
| Foreign Devices connected to network | IntraVUE identifies new devices with a tan colored box which is differentiated from the admin verified blue colored boxes. A red line will indicate the device is no longer connected. The event log will provide details of when the device was connected to the network. |
| Accidental move to wrong switch port | The potential for a connection to be accidentally changed due to device additions or just servicing the switch is becoming more common. IntraVUE monitors the moves and provides a graphic indication if a device is moved. The Event Log will also identify the day and time the move occurred. |
| Device failure or automatic restarting | IntraVUE provides a live animated graphic that can show a disconnected device by a red line. A first check would be to see if the connection to the switch is still made. If so, the event log will show if there have been several intermittent disconnections prior to failure. |
| Bad RSTP, Ring Switches, or accidental cable loops | The event log will show IntraVUE oscillating between two links or report the same MAC addresses on two different ports. These disturbances may also be seen as the network constantly changing in the main map view. |
|
Intermittent losses caused vibration, electrical noise, and moisture |
In a good network there should be no ping failures. The ping % failures rate per minute can be trended to identify connection problems. The Multi-device threshold graphs can help pinpoint the time and frequency of failures that help identify potential causes. |
| Devices starting to degrade in performance | Constant "empty" spaces or drops in the application threshold graphs (Xmit BW and/or Recv BW) but not in the communication physical threshold graphs (Ping failure / delay) indicate that a device is not sending or receiving traffic and troubleshooting or replacement is required. Verification can be done on the receiving device communication & application threshold graphs. |
| Large file transfers | These can be seen easily when looking at the transmit bandwidth and received bandwidth threshold graphs between two separate devices. |
| Communication module or switch lockups, power failures, or resets | A connection's properties can show trends of the transmitted / received data vs below ping response / ping failure percentages. A drop in data communication at the same time as ping failure at 100% can provides clues of this behavior. |
| Non-compliant device replacement, Device Deployment | A device properties can provide information such as vendor, model number, and version of newly added devices. IntraVUE also automatically detects if a device has a web link, or provides means to add additional information in the device properties |


